
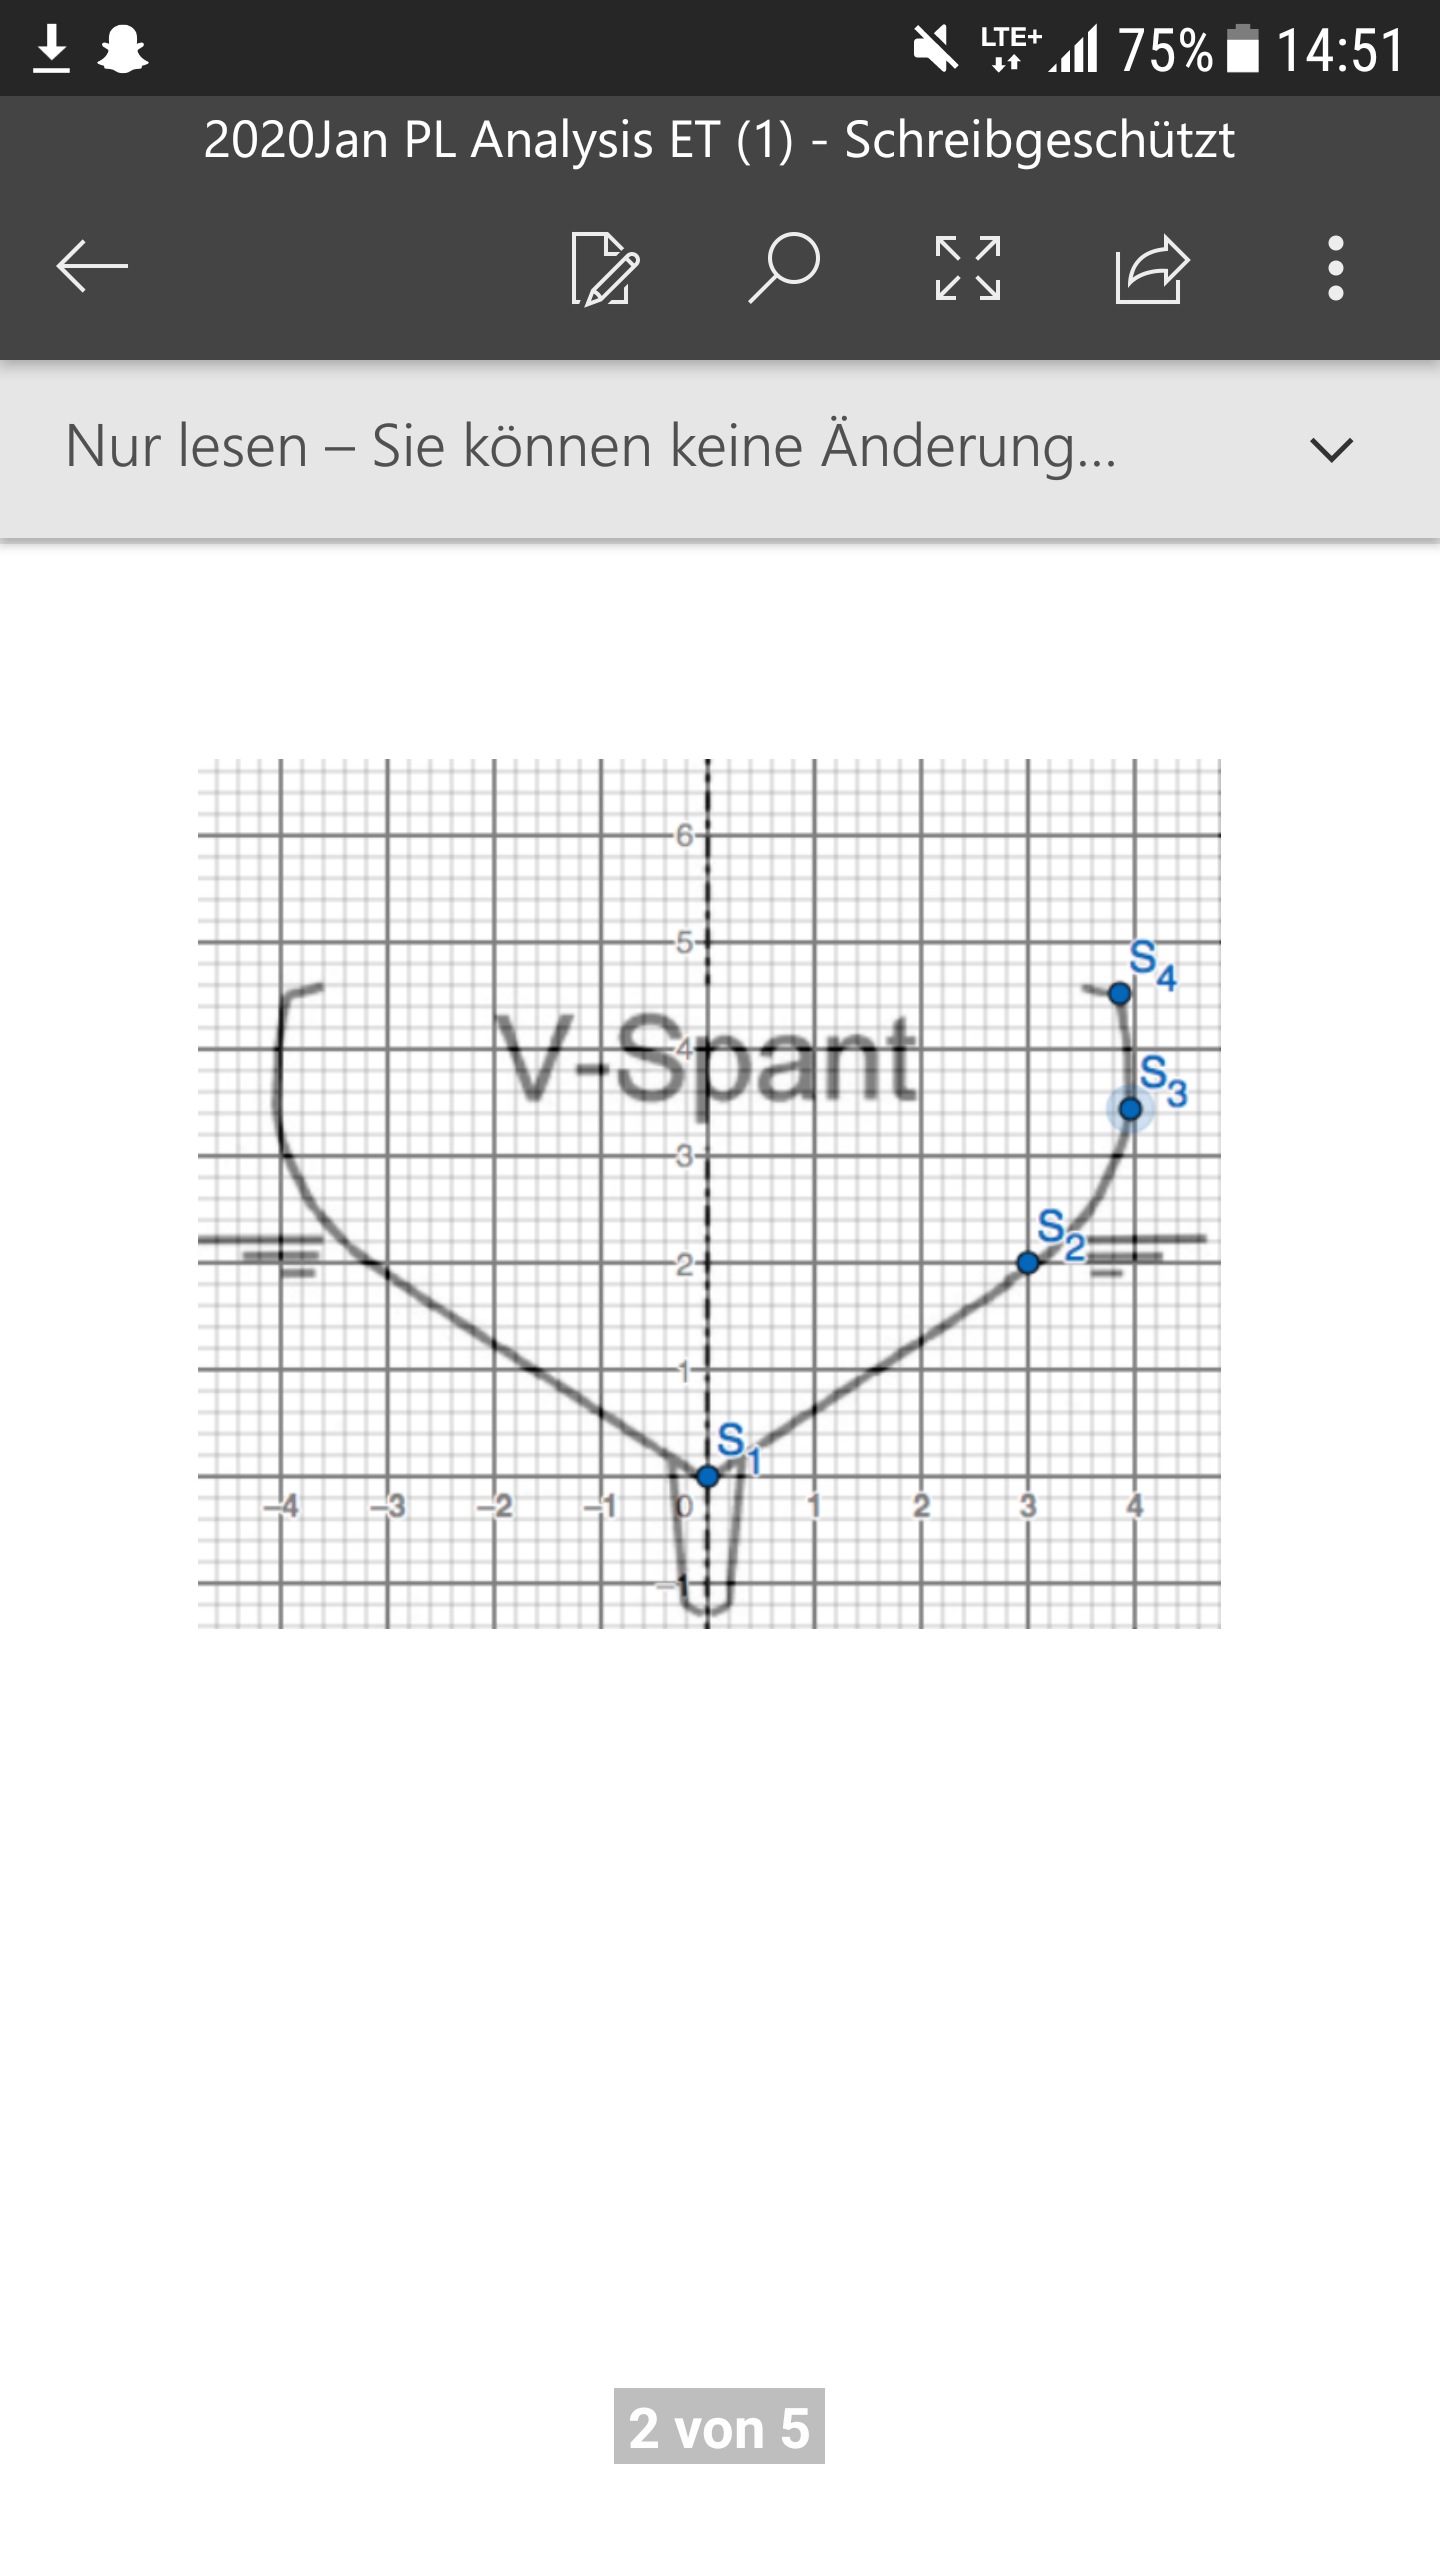
 wie macht man hier eine Spline-interpolation? Und wie kann man die ganzrationale Funktion aufstellen die annähernd so aussieht. Mit Gauß-algorithmus hab ich es schon versucht irgendwas hab ich falsch gemacht.
https://tools.timodenk.com/?p=cubic-spline-interpolation
Punkte eingeben, x und y vertauschen. Das Ergebnis ist also um 90 Grad gedreht.
Bild kann man hier wohl nicht einfügen.
\documentclass[11pt]{article}
% graphics
\usepackage{tikz}
\usepackage{pgfplots}
\pgfplotsset{compat=1.12}
\usepgfplotslibrary{fillbetween}
\begin{document}
\begin{tikzpicture}
\pgfplotsset{
scale only axis,
}
\begin{axis}[
xlabel=$x$,
ylabel=$y$,
samples=100,
]\addplot [only marks] table {
0 0
2 3
3.5 4
4.6 3.8
};
\addplot[][domain=0:2]{+-0.044811216114290786*x^3+2.827865638953087e-62*x^2+1.6792448644571631*x^1+0*x^0};
\addplot[][domain=2:3.5]{+-0.03179673750684*x^3+-0.07808687164470474*x^2+1.8354186077465726*x^1+-0.10411582885960631*x^0};
\addplot[][domain=3.5:4.6]{+0.12483412589894688*x^3+-1.722710937405467*x^2+7.59160283790924*x^1+-6.819664097382718*x^0};\end{axis}
\end{tikzpicture}
\end{document}
Punkte: 10